
The Trump administration has cast the net of immigration enforcement wider than previous administrations in its search for individuals who may be deportable from the United States. To achieve this, it no longer prioritizes its use of enforcement personnel and resources to focus first on individuals who may present threats to public safety. Instead, the administration has issued policies that treat all infractions of the law as equally deserving of enforcement action. Increasingly, individuals with no criminal records have been apprehended, regardless of their social and economic ties to U.S. families, communities, and employers.
This shift in enforcement approach has resulted in increased arrests and removals tied to enforcement efforts in the interior of the United States. According to publicly-available government statistics, over a three-year period—from Fiscal Year (FY) 2016 through FY 2018— the total number of arrests conducted by U.S. Immigration and Customs Enforcement (ICE) in FY 2018 was 44 percent higher than in FY 2016. Additionally, the number of at-large arrests—those that ICE conducted in the community as opposed to a custodial setting such as a prison or jail—increased from 30,348 in FY 2016 to 40,066 in FY 2017. Furthermore, the number of removals from the United States attributable to arrests by ICE increased from 65,322 to 95,360—an increase of 46 percent.
To better understand the changing interior enforcement trends under the Trump administration, this report analyzes individual-level data on immigration enforcement outcomes obtained from ICE by the American Immigration Council through Freedom of Information Act (FOIA) litigation (“ICE Data”). We examined interior immigration enforcement through three key enforcement events: ICE encounters, ICE arrests, and removals (see definitions box on page 4).
ICE provided the records we analyze in this report in three separate datasets, one for each enforcement event type. These data include 1,199,026 encounters, 381,370 arrests, and 650,944 removals that occurred between January 1, 2016, and September 23, 2018. These data ranges allow us to conduct a comparative analysis of interior enforcement events between the last part of the Obama administration and the first part of the Trump administration. Where our analysis compares rates or proportions between the administrations, we consider the entire time period covered by the data and refer to “the last part of the Obama administration and the first part of the Trump administration.” Where our analysis compares the number of occurrences of a given type of enforcement activity between administrations, we constructed two 365-day periods, which allowed us to compare the “last year of the Obama administration” versus the “first year of the Trump administration.”
All references to years in this report refer to calendar years, unless otherwise indicated.
The main questions we address in our analysis are the following:
- How do the general trends in interior enforcement under the Trump administration vary from those of the Obama administration?
- Who are the individuals who have been subject to interior enforcement under the Trump administration versus the Obama administration? For example, are there differences in the apprehended individuals’ gender, national origin, and criminal history?
- Are there differences in enforcement strategies and geographical distribution of interior enforcement under the Trump administration versus the Obama administration?
Our main findings are as follows:
Overall Trends
- Looking at the same months in consecutive years between 2016 and 2018, there was a consistent increase in the number of ICE encounters.
- Between 2016 and 2017, there was an uptick in the monthly number of arrests; in 2018, the monthly number of arrests remained relatively stable.
- The number of removals in 2017 was lower than in 2016 for most months. This trend reversed itself in 2018 when the monthly number of removals was consistently higher than in the equivalent months in 2017.
Who Is Subject to Enforcement Actions?
- Proportionally, ICE encountered and arrested more women during the first part of the Trump administration than it did during the last part of the Obama administration.
- There was a sharp increase in the number of U.S. citizens encountered by ICE during the first part of the Trump administration—compared to the last part of the Obama administration. In the first year of the Trump administration, ICE encountered 27,540 U.S. citizens. In comparison, during the last year of the Obama administration ICE encountered 5,940 U.S. citizens.
- Over 86 percent of all removals both in the last part of the Obama administration and the first part of the Trump administration involved individuals either with no criminal convictions or with only non-violent convictions.
Enforcement Strategies and Geographical Distribution of Enforcement
- Both in the last part of the Obama administration and the first part of the Trump administration, over 70 percent of encounters and over 60 percent of arrests were conducted through the Criminal Alien Program (CAP).
- Compared to the last year of the Obama administration, the volume of both at-large and custodial arrests increased during the first year of the Trump administration. However, the percentage of at-large arrests has remained stable at around 27 percent in both years.
- The percent increase in the number of at-large arrests between the last year of the Obama administration and the first year of the Trump administration has been geographically uneven, with the largest percent increases occurring in the ICE Areas of Responsibility (AOR) in Philadelphia, Buffalo, and Phoenix.
Definitions of Encounters, Arrests, and Removals
ICE did not provide definitions of “encounters,” “arrests,” and “removals” in its production of the datasets examined in this report. However, ICE did provide definitions of these terms in its production of other records in a prior FOIA litigation, AIC vs. DHS (CAP) FY2010-2013 (on file with American Immigration Council). We have no reason to believe that these definitions have changed since then.
Encounters: ICE has defined an “encounter” of a person as “the interview, screening, and determination of his/her citizenship, nationality, and lawful presence (i.e., whether or not the alien is present in the United States after the expiration of the period of stay authorized by the Secretary or is present in the United States without being admitted or paroled), and legal right to remain in the United States of America. An encounter, detainer, or charging documents issued by ICE does not necessarily result in the individual being placed into ICE custody.”
Arrests: ICE has defined “arrest” date as the date on which “an individual was either booked into ICE custody or processed prior to being booked into ICE custody.”
Removals: By “removal,” we generally mean the deportation of an individual, which includes “returns.” According to ICE, “returns” include “Voluntary Returns, Voluntary Departures and Withdrawals under Docket Control.”
For as long as ICE has existed, the agency has had some measure of discretion in deciding what cases to pursue. For instance, under what became known as the “Morton memorandum” in 2010, immigration-enforcement priorities included noncitizens who posed a risk to public safety or national security (including most of those noncitizens who had criminal convictions), recently arrived undocumented immigrants, and anyone who had ignored an order of removal or who re-entered the country after having been deported. The millions of long-time undocumented immigrants without criminal records were deliberately not defined as priorities.
Under the Trump administration, however, the pool of individuals who may be subject to deportation if they come into contact with immigration enforcement authorities has expanded dramatically. In large part, this has been accomplished by redefining as an “enforcement priority” virtually any noncitizen who has committed (or might have committed) a legal infraction of any kind.By broadening the “enforcement priority” list without specifying levels of importance, and by including whomever any immigration officer considers to be a “risk to public safety,” the Trump administration has severely curtailed immigration enforcement agents’ discretion to focus on those known to be violent or dangerous.
In addition, the administration sought to eliminate humanitarian protections—such as Deferred Action for Childhood Arrivals (DACA) and Temporary Protected Status (TPS) —that had previously shielded hundreds of thousands of noncitizens from deportation. Attacks on these programs have made many more people vulnerable to enforcement actions. Moreover, vulnerable populations and individuals, like those who have filed for U or T visas, who might be eligible for relief from deportation are being targeted for removal. As a result, an increased number of immigrants have been newly added to the pool of noncitizens subject to enforcement action.
Another aspect of the Trump administration’s more aggressive enforcement posture is the increased activity in and around “sensitive locations,” such as churches or hospitals, and enforcement actions within the wider immigrant community, as opposed to in custodial settings. In the process, more and more bystanders (individuals who happen to be present at a site where an enforcement action is being conducted) without criminal records are finding themselves caught up in enforcement actions known as “collateral arrests.”
Enforcement Without Priorities
The broad contours of the expanded approach to immigration enforcement were laid out in President Trump’s executive order, “Enhancing Public Safety in the Interior of the United States,” signed on January 25, 2017.The order directs agencies to “employ all lawful means to ensure the faithful execution of the immigration laws of the United States against all removable aliens.”The order also expansively defines as a priority for enforcement any non-U.S. citizen who has been convicted of a crime—or even charged with a crime—or who has “committed acts” that might constitute a crime.Other priorities include any non-citizen who has engaged in “willful misrepresentation” before a government agency, who has “abused” any public benefits program, or who an immigration officer thinks might pose “a risk to public safety or national security.”
Furthermore, the subsequent Department of Homeland Security (DHS) memorandum implementing this executive orderseverely curtailed the long-standing ability of immigration-enforcement personnel to exercise “discretion.” Discretion refers to the ability of law enforcement agents to prioritize some cases over others based on the severity of the offense or the extenuating circumstances which might apply to a particular individual. In contrast to the exercise of discretion by previous administrations both Democratic and Republican, the Trump administration has mandated enforcement against any and all deportable individuals. As a result, all undocumented immigrants are priorities for deportation, as are lawful permanent residents who have committed relatively minor infractions of the law. The ties which these individuals might have in the United States—length of stay, U.S.-citizen children, home ownership—are no longer considered relevant to enforcement decisions.
Withdrawal of Humanitarian Protections and Targeting Vulnerable Populations
The Trump administration has exposed nearly one million people to the threat of deportation by ending two humanitarian programs that had formerly allowed them to remain in the United States: DACA for undocumented immigrants brought to the country as children, and TPS for the nationals of countries suffering the effects of armed conflict or natural disaster.
The termination of DACA on September 5, 2017, rendered nearly 690,000 people deportable, even though the administration allowed those whose deferred action expired before March 5, 2018, to apply for renewal one final time. While a court order issued in January 2018 has temporarily allowed DACA recipients to continue applying for deferred action, more than a half-million young people who are, or would have become, eligible to newly apply for DACA will be unable to do so.
Starting in September 2017, the Trump administration began to terminate TPS designations for El Salvador, Haiti, Honduras, Nepal, Nicaragua, and Sudan—although the effective dates of those terminations were delayed for 12 or 18 months, depending on the country.In March 2018, the administration also announced an end to Deferred Enforced Departure (DED) for Liberia, an administrative mechanism similar to TPS. On October 3, 2018, a federal court in California blocked the administration’s termination of TPS for nationals of El Salvador, Haiti, Nicaragua, and Sudan.In conjunction with developments in other lawsuits challenging the termination of TPS designations, over 300,000 peoplereceived a temporary reprieve from deportation. Even if the courts ultimately conclude that the terminations were unlawful and restore their temporary status, their vulnerability to immigration enforcement may persist; the courts cannot provide a permanent solution for these individuals and the administration may try alternative procedures to end those protections.
Separately, ICE has subjected to enforcement other vulnerable groups that may be eligible for relief from removal. For instance, the undocumented sponsors of unaccompanied minors have been singled out for questioning, criminal prosecution, and deportation. Similarly, ICE has indicated that individuals who have filed for, or are likely eligible for, a U visa intended for victims of crime, or a T visa intended for victims of trafficking, will be subject to enforcement.
Enforcement in Sensitive Locations
The Trump administration has increased the number of enforcement actions at “sensitive locations,” particularly in jurisdictions where local law enforcement limits cooperation with ICE. According to ICE’s own guidance on the subject, the agency is supposed to practice restraint when it comes to arresting people at “sensitive locations” such as schools, churches, and hospitals—as well as “any organization assisting children, pregnant women, victims of crime or abuse, or individuals with significant mental or physical disabilities.” Arrests or other enforcement actions in such locations are permissible only under “exigent circumstances” when public safety or national security is at stake. However, ICE now appears to be interpreting “exigent circumstances” broadly, as evidenced by reports of arrests conducted outside of a church and in front of a school.
One category of “sensitive locations” absent from ICE guidance on the subject is courthouses. Despite the sensitive nature of the work that takes place in courthouses—witnesses to crimes providing testimony, jurors deliberating the fate of the accused, etc.—the agency does not consider these locations to be sensitive. However, prior to the Trump administration, DHS had a policy in place limiting courthouse arrests. According to that policy, “enforcement actions at courthouses [would] only be executed against individuals falling within the public safety priorities of DHS’ immigration enforcement priorities set forth in the November 20, 2014 from Secretary Johnson.” After a significant increase in arrests at courthouses in 2017, ICE released on January 10, 2018, guidance that officially gave its agents permission to conduct civil immigration enforcement at courthouses.
Immigration Enforcement in Communities at Large
Heightened enforcement has occurred not only in sensitive locations, but within the broader community as a whole. The result is a growing number of “at-large” arrests—that is, arrests outside of “controlled settings” such as local jails. According to ICE’s publicly released statistics, from FY 2016 to FY 2018, at-large arrests grew from 30,348 to 40,536—an increase of 33 percent.In the process, more bystanders without criminal convictions are swept up by ICE in the course of enforcement operations, which the agency refers to as “collateral arrests.” In jurisdictions that still cooperate with ICE, local law enforcement also conducts immigration enforcement as part of a growing number of 287(g) agreements with ICE. Section 287(g) of the Immigration and Nationality Act allows DHS to enter into formal written agreements with state or local police departments and deputize selected state and local law enforcement officers to perform the functions of federal immigration agents. According to ICE, as of May 20, 2019, at least 90 jurisdictions in 21 states have 287(g) agreements with the agency.
Our empirical analysis of the ICE enforcement data allowed us to analyze the overall enforcement trends and basic characteristics of the population subjected to encounters, arrests, and removals, including gender, country of citizenship, and criminal background. We also analyzed the ICE enforcement programs associated with encounters and arrests. Lastly, we developed a general geographical profile of custodial and at-large arrests.
Overall Enforcement Trends
A comparison of monthly totals between 2016 and 2018 reveals a consistent pattern of increases in the number of encounters. For example, Figure 1 indicates that the number of encounters in January increased from 27,540 in 2016 to 33,435 in 2017, reaching 38,298 in 2018. The same pattern holds true for every month, with the exception of March 2018, when the number of encounters was roughly the same as in March 2017. The highest number observed in the entire period was 44,828 in May 2018 (see further details in Appendix 2: Table A1).
Figure 1. ICE Encounters, January 2016 – August 2018
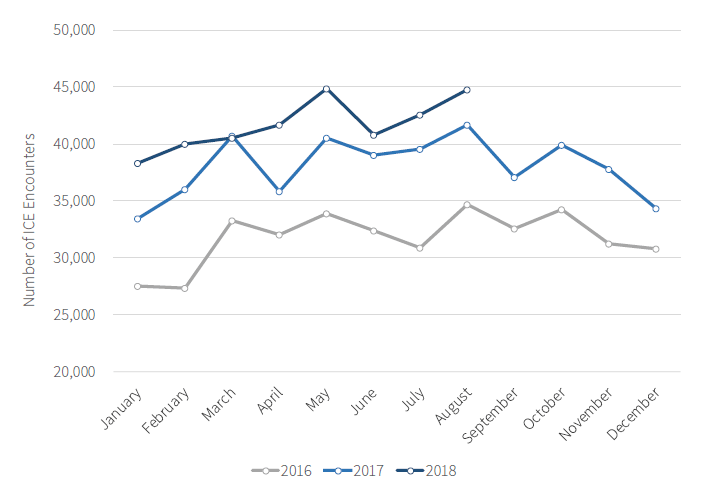
Note: The data analyzed in this figure ends with August 2018, given that the ICE Data ends on September 23, 2018.
Source: Authors’ original analysis of ICE Data obtained through FOIA.
As shown in Figure 2, after President Trump took office in January 2017, the number of arrests conducted by ICE each month was consistently higher than the total number of arrests during the corresponding months in 2016. Starting in February 2017, the monthly number of arrests was never lower than 11,000. While the monthly average of arrests conducted during the last year of the Obama administration was 9,195, the monthly average during the first year of the Trump administration was 13,156. In 2018, the number of monthly arrests seemed to have stabilized and remained fairly consistent between 12,573 and 14,276 (see further details in Appendix 2: Table A1).
Figure 2. ICE Arrests, January 2016 – August 2018
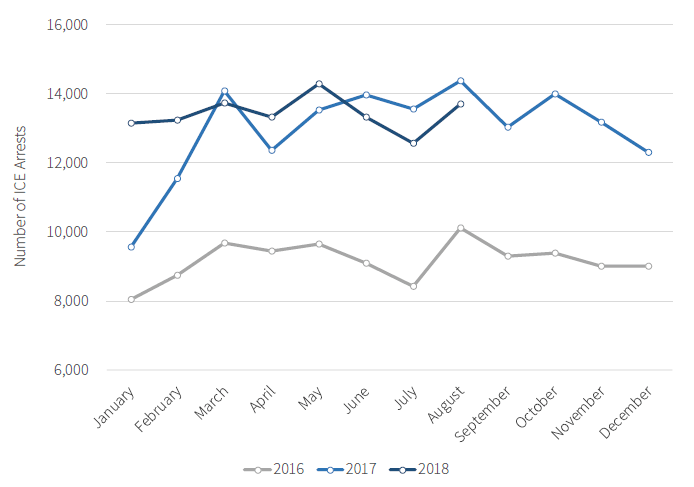
Note: The data analyzed in this chart ends with August 2018, given that the ICE Data ends on September 23, 2018.
Source: Authors’ original analysis of ICE Data obtained through FOIA.
Figure 3 shows monthly totals for removals. Unlike the trends for encounters and arrests, the number of removals in 2017 was lower than in 2016 for most months. This trend reversed itself in 2018 when the monthly number of removals was consistently higher than in the equivalent month in 2017 (see further details in Appendix 2: Table A1).
Figure 3. ICE Removals, January 2016 – August 2018
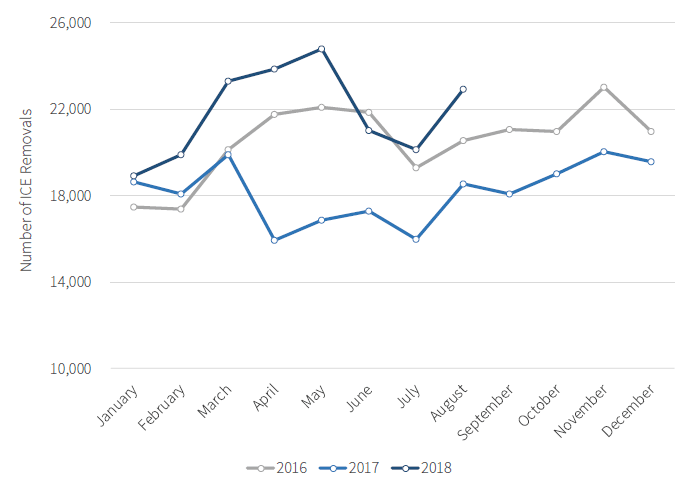
Note: The data analyzed in this chart ends with August 2018, given that the ICE Data ends on September 23, 2018.
Source: Authors’ original analysis of ICE Data obtained through FOIA.
Who Is Subject to Enforcement Actions?
Slight Feminization of Enforcement
As shown in Figure 4, the distribution of encounters and arrests by gender during the first part of the Trump administration showed a slight feminization of enforcement at the “encounters” and “arrests” levels. This means that, proportionally, ICE encountered and arrested more women during the beginning of the Trump administration than it did during the last part of the Obama administration.
Figure 4. Enforcement Outcomes by Gender
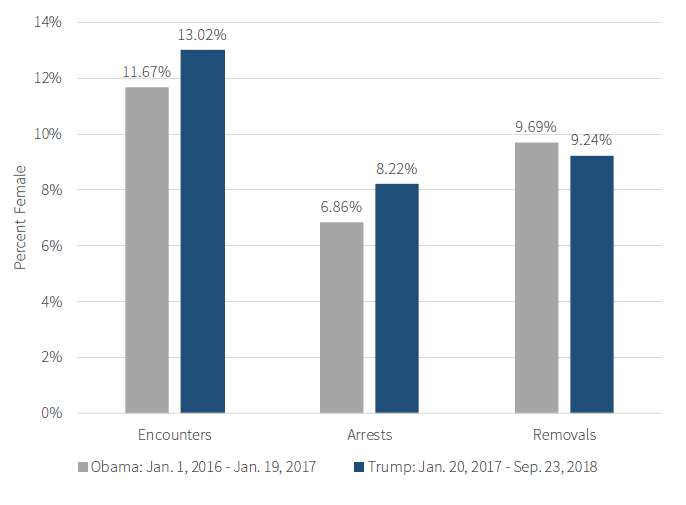
Note: Cases for which ICE reported gender as “unknown” are not included.
Source: Authors’ original analysis of ICE Data obtained through FOIA.
A Growing Number of U.S. Citizens Subjected to Enforcement Action
As shown in Table 1, the distribution of individuals encountered by ICE according to their citizenship reveals some notable trends. First, the representation of Mexican, Salvadoran, and Haitian citizens in the overall pool of encounters dropped in the first part of the Trump administration, compared to the last part of the Obama administration. The share of most of the other countries in the top 10 list experienced a slight increase.
Perhaps the most striking change is the increase in the number of U.S. citizens encountered by ICE. In the first year after President Trump took office, ICE encountered 27,540 U.S. citizens. In comparison, during the last year of the Obama administration ICE encountered 5,940 U.S. citizens. This trend poses questions about the effectiveness of ICE’s enforcement approach and whether certain U.S. citizens who may “appear deportable” have become increasingly vulnerable to enforcement actions.
Table 1. ICE Encounters: Top 10 Countries of Citizenship of Encountered Individuals
|
Country of |
Total Encounters |
Obama |
Trump |
Percentage |
|||
|---|---|---|---|---|---|---|---|
|
Mexico |
43.82% |
44.32% |
43.56% |
-0.75 |
|||
|
Guatemala |
6.22% |
5.33% |
6.67% |
1.34 |
|||
|
Honduras |
5.24% |
4.83% |
5.45% |
0.62 |
|||
|
El Salvador |
4.79% |
4.86% |
4.76% |
-0.10 |
|||
|
United States |
3.92% |
1.48% |
5.14% |
3.66 |
|||
|
Dominican Republic |
2.76% |
2.65% |
2.82% |
0.17 |
|||
|
Cuba |
2.69% |
2.47% |
2.80% |
0.34 |
|||
|
China |
1.87% |
1.53% |
2.04% |
0.50 |
|||
|
Jamaica |
1.62% |
1.53% |
1.66% |
0.13 |
|||
|
Haiti |
1.14% |
1.17% |
1.13% |
-0.03 |
|||
|
Other |
21.57% |
21.08% |
21.81% |
0.74 |
|||
|
Unknown |
4.35% |
8.75% |
2.15% |
-6.60 |
|||
|
Total |
100.00% |
100.00 % |
100.00% |
|
|||
Source: Authors’ original analysis of ICE Ddata obtained through FOIA.
Table 2 shows the top 10 countries of citizenship of individuals arrested by ICE. During both the last part of the Obama administration and the first part of the Trump administration, Mexicans and nationals from the Northern Triangle of Central America represented roughly 85 percent of all arrests. However, the share of Mexicans arrested decreased and the proportion of Guatemalans and Hondurans increased across the two administrations. By contrast, the proportion of Salvadorans remained practically the same across the two administrations.
Table 2. ICE Arrests: Top 10 Countries of Citizenship of Arrested Individuals
|
Country of Citizenship |
Total Arrests |
Obama |
Trump |
Percentage |
|---|---|---|---|---|
|
Mexico |
60.94% |
63.45% |
59.85% |
-3.60 |
|
Guatemala |
10.06% |
8.55% |
10.72% |
2.17 |
|
Honduras |
8.13% |
7.40% |
8.45% |
1.05 |
|
El Salvador |
6.36% |
6.36% |
6.37% |
0.01 |
|
Dominican Republic |
1.35% |
1.57% |
1.26% |
-0.31 |
|
Cuba |
1.18% |
0.88% |
1.32% |
0.44 |
|
Colombia |
0.71% |
0.75% |
0.69% |
-0.07 |
|
Jamaica |
0.70% |
0.80% |
0.66% |
-0.13 |
|
Ecuador |
0.66% |
0.64% |
0.67% |
0.02 |
|
Brazil |
0.61% |
0.45% |
0.67% |
0.22 |
|
Other |
9.25% |
9.06% |
9.33% |
0.27 |
|
Unknown |
0.03% |
0.08% |
0.01% |
-0.07 |
|
Total |
100.00 % |
100.00 % |
100.00 % |
|
Source: Authors’ original analysis of ICE Data obtained through FOIA.
Table 3 shows the top 10 countries of citizenship of individuals removed by ICE. During the last part of the Obama administration and the first part of the Trump administration, the proportion of Mexicans and nationals from the Northern Triangle represented more than 90 percent of all removals. However, the share of Mexicans and Salvadorans removed under Trump declined by 4.20 and 2.23 percentage points, respectively. At the same time, the share of Guatemalans and Hondurans removed went up by 2.96 and 1.14 percentage points, respectively.
Table 3. ICE Removals: Top 10 Countries of Citizenship of Removed Individuals
|
Country of Citizenship |
Total Removals |
Obama |
Trump |
Percentage |
|---|---|---|---|---|
|
Mexico |
57.46% |
60.00% |
55.80% |
-4.20 |
|
Guatemala |
16.69% |
14.90% |
17.86% |
2.96 |
|
Honduras |
10.30% |
9.61% |
10.75% |
1.14 |
|
El Salvador |
7.56% |
8.91% |
6.68% |
-2.23 |
|
Haiti |
1.03% |
0.90% |
1.12% |
0.22 |
|
Dominican Republic |
0.77% |
0.76% |
0.78% |
0.03 |
|
Brazil |
0.60% |
0.53% |
0.65% |
0.12 |
|
Ecuador |
0.49% |
0.46% |
0.51% |
0.05 |
|
Colombia |
0.45% |
0.41% |
0.48% |
0.07 |
|
Nicaragua |
0.35% |
0.32% |
0.36% |
0.04 |
|
Other |
4.28% |
3.20% |
4.99% |
1.79 |
|
Unknown |
0.01% |
0.01% |
0.02% |
0.01 |
|
Total |
100.00% |
100.00% |
100.00% |
|
Source: Authors’ original analysis of ICE Data obtained through FOIA.
A Sizable Proportion of Deported Individuals Did Not Have Any Criminal Convictions
Figure 5 shows the proportion of individuals removed by ICE by their most serious criminal convictions. During the entire period examined, ICE removed more individuals who did not have a criminal conviction (43.28 percent) than it did individuals with a serious or violent conviction (13.81 percent). Put another way, based on this categorization, over 85 percent of all removals between January 2016 and September 2018 involved individuals with either no conviction or individuals who were not convicted of a crime classified as violent or serious (following MPI’s definition, see methodology in Appendix 1). This pattern remained basically unaltered across administrations. While the overall profile has not changed drastically, one category that did experience a significant uptick is “traffic offense,” which increased from 1.68 percent of all removals during the last part of the Obama administration to 2.75 percent of all removals under the first part of the Trump administration (see further details in Appendix 2: Tables A2 and A3). The number of removals with “traffic offense” as the most serious conviction increased by 42.17 percent between the last year of the Obama administration and the first year of the Trump administration.
Figure 5. Most Serious Convictions Among Removed Individuals
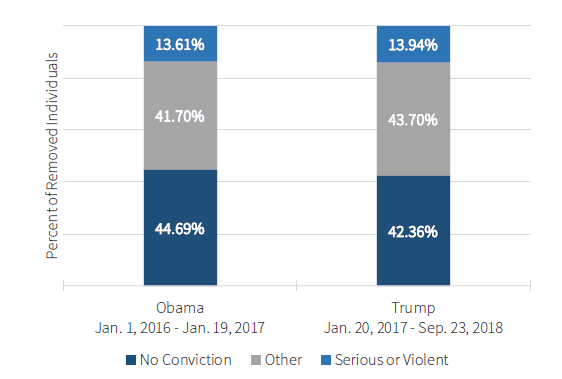
Note: Categories follow MPI classification of convictions. With respect to the “No Conviction” category, we treated missing values for the “Most Serious Conviction” variable as indicating a lack of criminal conviction.
Source: Authors’ original analysis of ICE Data obtained through FOIA.
How and Where Is ICE Conducting Immigration Enforcement?
CAP Continues to Play an Important Role in Encounters
When looking at the specific programs through which the encounters occurred, there is a great deal of continuity from administration to administration. This suggests that there are some structural components of the enforcement machine that transcend specific presidencies. Table 4 shows ICE encounters by “event type.” Both in the last part of the Obama administration and the first part of the Trump administration, most of the encounters took place through the Criminal Alien Program (CAP), which supports ICE in the identification, arrest, and removal of individuals incarcerated within federal, state, and local prisons and jails, as well as within the community at large. Specifically, about three out of four encounters in both periods analyzed were carried out through CAP.
The only remarkable variation across periods is observed in the categories “Enforcement and Removal Operations (ERO) Criminal Alien Program,” which dropped by 11.3 percent, and CAP local, which went up by 10.1 percent. Given that ICE did not provide us with definitions for the variables in the dataset, it is unclear what exactly is included in the generic category “ERO Criminal Alien Program.”
Table 4. ICE Encounters by Event Type
|
Encounter |
Obama |
Trump |
Percentage |
|---|---|---|---|
|
ERO Criminal Alien Program |
40.36% |
29.03% |
-11.33 |
|
CAP Local |
27.50% |
37.62% |
10.11 |
|
287(g) Program Activities |
7.59% |
5.53% |
-2.06 |
|
Fugitive Operations (Event) |
6.48% |
7.05% |
0.57 |
|
CAP Federal |
5.52% |
4.85% |
-0.67 |
|
CAP State |
2.51% |
2.16% |
-0.35 |
|
ERO Reprocessed |
1.60% |
1.36% |
-0.24 |
|
Administrative Criminal Alien |
1.43% |
1.19% |
-0.24 |
|
Violent Criminal Alien Section |
0.92% |
1.34% |
0.41 |
|
Other |
3.65% |
3.65% |
0.00 |
|
Unknown |
2.44% |
6.23% |
3.79 |
|
Total |
100.00% |
100.00% |
|
Source: Authors’ original analysis of ICE Data obtained through FOIA.
One unexpected trend is that the overall percentage of encounters conducted through 287(g) program activities decreased in the Trump period. In the first year of the Trump administration, 25,424 encounters occurred through 287(g); this is an 11.92 percent decline with respect to the number conducted in the last year of the Obama administration (28,865). This result is unexpected because the majority of 287(g) agreements that ICE currently has with law enforcement agencies were signed after Trump took office on January 20, 2017. The decrease in the proportion of 287(g) encounters may have to do with the fact that some jurisdictions that had previously engaged in immigration enforcement no longer have 287(g) agreements under the Trump administration.
Also contrary to what might be expected, the proportion of encounters produced through the National Fugitive Operations Program has not significantly increased during the Trump period. ICE uses this program to locate, arrest, and remove individuals through at-large enforcement efforts. This program purportedly prioritizes enforcement efforts toward immigrants who present “a threat to national security and public safety.” The Trump administration has allocated a significant amount of resources to the program and has rhetorically defended its use. However, this investment of resources did not translate into increased enforcement outcomes.
Increased Collaboration with Local Enforcement Agencies
Table 5 shows the distribution of ICE arrests by “arrest methods” or programs. Both in the last part of the Obama administration and the first part of the Trump administration, most arrests were conducted through CAP. However, the proportion of arrests that resulted from the collaboration of local incarceration authorities experienced a noticeable spike under the Trump administration. Conversely, arrests conducted through federal incarceration authorities decreased during the Trump administration.
Table 5. Top ICE Arrest Methods
|
Arrest Method |
Obama |
Trump |
Percentage |
|---|---|---|---|
|
CAP Local Incarceration |
33.65% |
41.44% |
7.79 |
|
CAP Federal Incarceration |
20.03% |
13.95% |
-6.08 |
|
Located |
12.90% |
12.74% |
-0.16 |
|
Non-Custodial Arrest |
10.17% |
11.42% |
1.25 |
|
CAP State Incarceration |
9.41% |
6.80% |
-2.61 |
|
Probation And Parole |
4.42% |
2.52% |
-1.90 |
|
ERO Reprocessed Arrest |
3.71% |
2.71% |
-1.00 |
|
287(g) Program |
3.35% |
5.96% |
2.61 |
|
Other Efforts |
0.98% |
1.13% |
0.15 |
|
Law Enforcement Agency Response Unit |
0.42% |
0.52% |
0.09 |
|
Other |
0.95% |
0.80% |
-0.15 |
|
Total |
100.00% |
100.00% |
|
Source: Authors’ original analysis of ICE Data obtained through FOIA.
Table 5 demonstrates the continuing reliance of the federal immigration enforcement system on the criminal justice system. Specifically, the combined proportion of arrests conducted through CAP federal, state, and local levels constituted 63.1 percent of all ICE arrests during the last part of the Obama administration, compared to 62.2 percent during the first part of the Trump administration. However, arrests conducted through CAP in local jails and prisons increased from 33.6 percent during the last part of the Obama period to 41.4 percent in the first part of the Trump administration. These results suggest that lack of cooperation by local communities might make it difficult for ICE to effectively carry out large-scale immigration enforcement without substantially increasing the number of ICE officers on the ground and/or changing its interior enforcement strategy.
The Geography of Immigration Enforcement
ICE classifies arrests into two groups: those that are conducted in the community (at-large arrests) and those that are conducted in a prison or jail setting (custodial arrests). We describe our classification procedure in Appendix 1, Section II.
We find that, overall, at-large arrests increased from 30,409 during the last year of the Obama administration to 42,772 during the first year of the Trump administration, representing a 41 percent increase. However, the number of at-large arrests as a proportion of all arrests has remained stable at around 27 percent in both years.
The rising number of at-large arrests is of concern given the potential chilling effects of interior immigration enforcement on undocumented immigrants’ willingness to engage with authority figures and public institutions. According to one study, undocumented immigrants who were informed that local police were working with ICE were far less likely to report crimes to the police, to use public services or conduct business that required the disclosure of personal information, and to participate in public events where police could be present.
Figures 6 and 7 show percent changes in arrests between the last year of the Obama administration and the first year of the Trump administration by Areas of Responsibility (AOR). These AORs are labeled “field offices” on the ICE website. However, because the ICE Data that we analyze refers to them as AORs, we use the term AOR in this report. During the last year of the Obama administration and the first year of the Trump Administration, 630 arrests did not contain AOR information and 29 arrests were assigned to “HQ AOR.” HQ AOR refers to the headquarters office and is not shown in Figures 6 and 7.
Figure 6 shows a map of 24 AORs and their respective percent changes in at-large arrests between the last year of the Obama administration and the first year of the Trump administration. Table A4 in Appendix 2 provides the underlying and other related statistics accompanying Figure 6.
Figure 6 shows that with the exception of Dallas and San Antonio AORs, all of the AORs experienced increases in at-large arrests under the Trump administration compared to the Obama administration. In addition, Table 6 shows that the increases in at-large arrests under the Trump administration were geographically uneven. For example, Washington AOR experienced only a 16 percent increase (see Table A4). In contrast, the top three AORs that experienced the highest percent increase under the Trump administration each had more than a 100 percent increase. These top three AORs were: Phoenix AOR (118 percent increase), Buffalo AOR (124 percent increase), and Philadelphia AOR (151 percent increase).
Figure 6. Change in At-Large Arrests from Obama to Trump Administrations
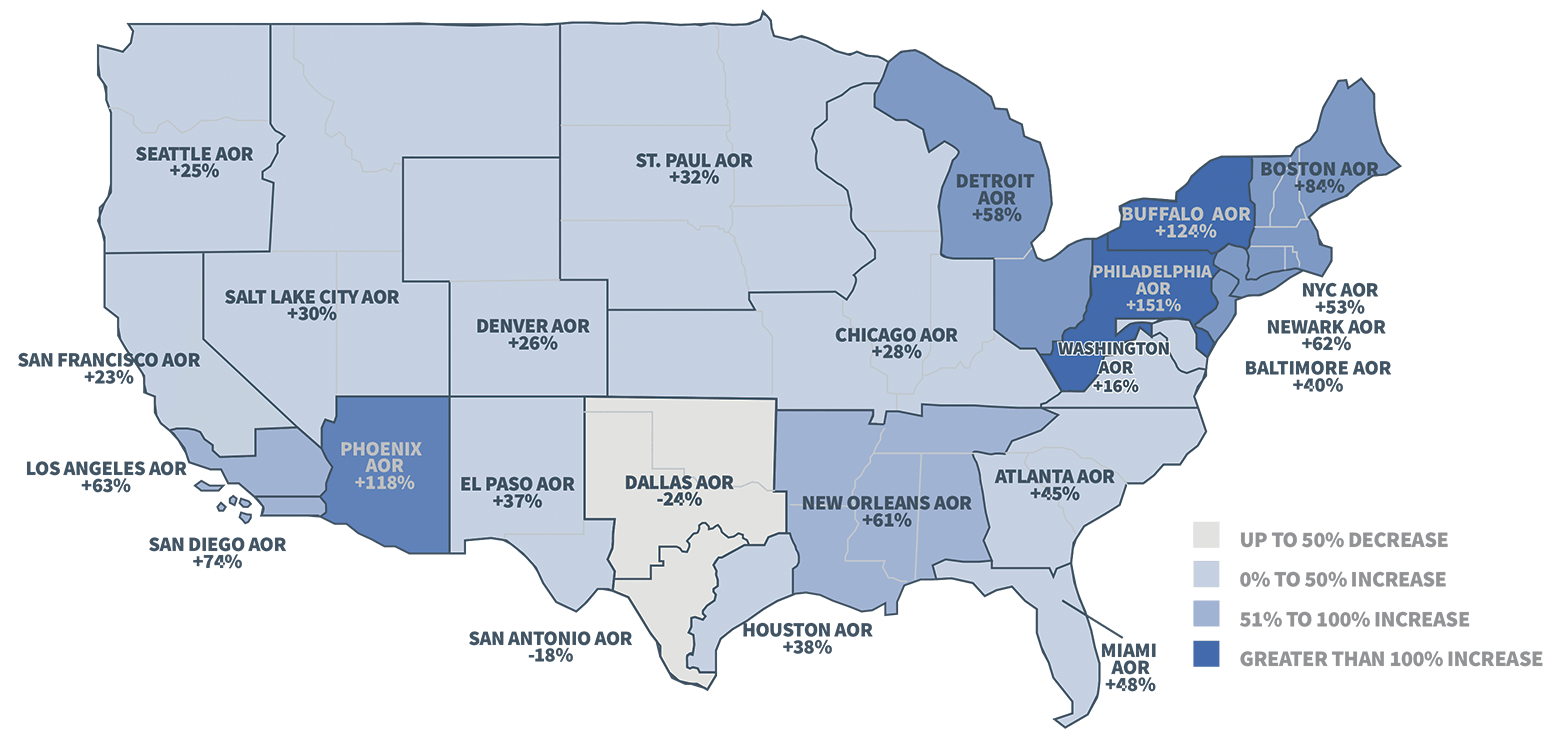
Source: Authors’ original analysis of ICE Data obtained through FOIA.
Over the same period, custodial arrests increased from 79,935 to 115,095, corresponding to a 44 percent increase. Figure 7 shows a map of 24 AORs and their respective percent changes in custodial arrests between the Obama and Trump administrations (for underlying and related statistics, see Table A4 in Appendix 2). It also shows that all of the AORs experienced increases in custodial arrests under the Trump administration compared to the Obama administration.
Figure 7 shows that some of the AORs that experienced the highest percent increase in at-large arrests experienced the lowest percent increase in custodial arrests. For example, Buffalo and Philadelphia AORs, which had the highest percent increase in at-large arrests, as discussed above, had some of the lowest percent increases in custodial arrests. Specifically, Buffalo and Philadelphia AORs were in the bottom four AORs in terms of percent increases in custodial arrests, at 12 percent and 17 percent increases, respectively. The top three AORs in terms of highest percent increases in custodial arrests were: New York City AOR (107 percent increase), Atlanta AOR (115 percent increase), and Miami AOR (132 percent increase).
Figure 7. Change in Custodial Arrests from Obama to Trump Administrations
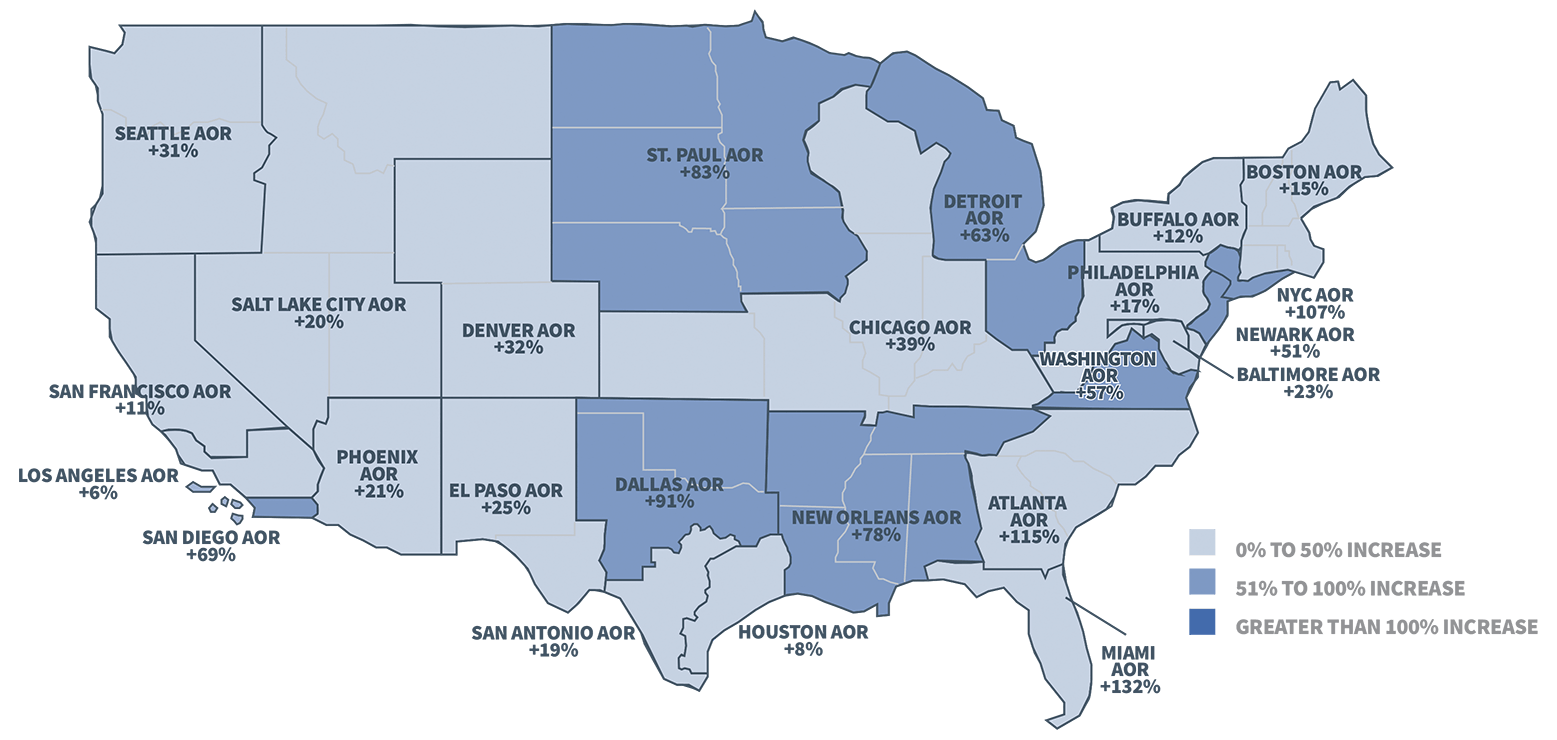
Source: Authors’ original analysis of ICE data obtained through FOIA.
This examination of immigration enforcement outcomes from years 2016 to 2018 offers important insights into how ICE operates, as well as the impact of the Trump administration’s approach to immigration enforcement.
Given the aggressive nature of the Trump administration’s immigration enforcement agenda, it is not surprising that the number of encounters and arrests has increased since President Trump took office. It is also not surprising that there has been a lag between the increase of encounters and arrests and the increase in removals. The increased number of individuals caught up in enforcement has generated a growing number of cases awaiting a decision.
Some trends, however, are unanticipated—namely, the growing proportion of women being subjected to enforcement and the steep increase in the number of U.S. citizens encountered by ICE under the Trump administration. The slight feminization of enforcement may be an unintended consequence of the de-prioritization of enforcement. Additionally, the increase in the number of U.S. citizens encountered by ICE raises questions about whether certain U.S. citizens who may “appear deportable” have become increasingly vulnerable to enforcement actions.
The proportion of deported individuals without criminal convictions, or with convictions that are not violent or serious, has remained relatively consistent under the Trump administration compared to the Obama administration. It is worth noting, however, that the proportion of deported individuals with no conviction or with non-violent or non-serious convictions was remarkably high during the Obama administration.
The data on the programs used by ICE to encounter and arrest individuals reveals a great deal of continuity from administration to administration. This suggests that there are some structural components of the enforcement machine that transcend specific presidencies. The data also reveals ICE’s continuing reliance on the criminal justice system for its enforcement actions.
The number of at-large arrests has increased under the Trump administration, even though the proportion of those arrests over the total number of arrests remained essentially the same. With the exception of Dallas and San Antonio AORs, all of the AORs experienced increases in at-large arrests under the Trump administration compared to the Obama administration. Unfortunately, the data on enforcement provided by ICE was not granular or complete enough to permit a full understanding of the geographical distribution of enforcement across counties in the United States.
While these descriptive findings offer an informative snapshot of changing trends in the overall interior enforcement landscape, further research is needed to better understand why certain groups and parts of the country have become more vulnerable to enforcement actions.
Classification of Criminal Convictions
To more precisely examine the government’s efforts to remove public safety threats, we classified removed individuals into three broad categories, following the Migration Policy Institute (MPI) and the FBI classification schemes:
- Individuals with no conviction: Individuals with missing values under the “most serious criminal conviction” variable.
- Serious or violent: Individuals whose “most serious” conviction was a serious or violent conviction according to independent classification schemes. These include (a) crimes that the FBI classifies as Part I; (b) a subset of those the FBI classifies as Part II (i.e., Part II-violent); and (c) domestic abuse crimes. According to the FBI’s decades-old crime classification system, “Part I” includes eight types of crimes, which criminologists have commonly understood to represent the most serious crimes. Those eight categories are murder and non-negligent homicide, forcible rape, robbery, aggravated assault, burglary, motor vehicle theft, larceny-theft, and arson. Part II, on the other hand, includes a broad spectrum of crimes that range from more to less serious. In an effort to further disaggregate the broad universe of FBI-Part II crimes, MPI classifies them as violent or nonviolent. Part II-violent includes crimes such as assault, battery, kidnapping, hit and run, weapons offenses, and sex offenses. Following MPI’s approach, we included these crimes (Part II-violent), as well as domestic abuse crimes, in our “serious or violent” category.
- Other: Individuals whose “most serious” conviction was for (a) a FBI Part 2 crime that is not violent according to MPI; (b) drug possession; (c) drug sale, distribution, or transportation; (d) an immigration crime (e.g., illegal entry or re-entry); (e) a nuisance crime; (f) driving under the influence (DUI); or (g) traffic offenses other than DUI.
Classification of Arrests
In its annual reports for FY 2017 and FY 2018, ICE distinguishes between at-large and custodial arrests. An at-large arrest is conducted in the community, whereas a custodial arrest occurs in a prison or jail setting. The ICE annual reports note that at-large arrests are identified as records with an arrest method of “Located,” “Non-Custodial Arrest,” or “Probation and Parole.” Other arrest methods are considered custodial arrests.
We confirmed that the arrest method variable contained in the AIC FOIA data that we analyze in this report is the same variable referred to in the annual reports by comparing the number of at-large and total arrests for FY 2017. This year was chosen because it is the only full year of arrest data obtained through AIC’s FOIA request. The number of at-large arrests in FY 2017 in the AIC FOIA data perfectly matched the number reported in the ICE annual report (40,066 at-large arrests). The number of total arrests was 143,470 in both the ICE annual report and the AIC FOIA data.
Table A1. Changes in Enforcement Outcomes
|
Month |
Encounters |
Arrests |
Removals |
||||||
|---|---|---|---|---|---|---|---|---|---|
|
2016 |
2017 |
2018* |
2016 |
2017 |
2018* |
2016 |
2017 |
2018* |
|
|
January |
27,540 |
33,435 |
38,298 |
8,046 |
9,575 |
13,161 |
17,485 |
18,662 |
18,903 |
|
February |
27,340 |
36,017 |
39,975 |
8,756 |
11,554 |
13,229 |
17,376 |
18,073 |
19,901 |
|
March |
33,252 |
40,694 |
40,530 |
9,669 |
14,084 |
13,736 |
20,126 |
19,916 |
23,294 |
|
April |
32,041 |
35,840 |
41,625 |
9,457 |
12,372 |
13,321 |
21,761 |
15,923 |
23,870 |
|
May |
33,907 |
40,497 |
44,828 |
9,652 |
13,527 |
14,276 |
22,107 |
16,886 |
24,820 |
|
June |
32,386 |
38,980 |
40,789 |
9,103 |
13,972 |
13,313 |
21,852 |
17,310 |
21,010 |
|
July |
30,903 |
39,562 |
42,577 |
8,436 |
13,567 |
12,573 |
19,301 |
15,971 |
20,123 |
|
August |
34,662 |
41,637 |
44,756 |
10,115 |
14,364 |
13,694 |
20,552 |
18,566 |
22,912 |
|
September |
32,543 |
37,030 |
29,177 |
9,306 |
13,045 |
8,569 |
21,071 |
18,065 |
11,520 |
|
October |
34,221 |
39,918 |
|
9,397 |
14,006 |
|
20,964 |
19,011 |
|
|
November |
31,223 |
37,745 |
|
9,015 |
13,176 |
|
23,028 |
20,059 |
|
|
December |
30,767 |
34,331 |
|
8,998 |
12,306 |
|
20,970 |
19,556 |
|
|
Total |
380,785 |
455,686 |
362,555 |
109,950 |
155,548 |
115,872 |
246,593 |
217,998 |
186,353 |
Note: Data for 2018 is partial (January 1 – September 23).
Source: Authors’ original analysis of ICE Data obtained through FOIA.
Table A2. Most Serious Criminal Conviction
|
Most Serious Conviction |
Obama |
Trump |
Percentage |
|---|---|---|---|
|
No Conviction |
44.69% |
42.36% |
-2.34 |
|
Other |
15.65% |
16.84% |
1.18 |
|
Illegal Entry* |
13.47% |
13.49% |
0.02 |
|
Driving Under Influence Liquor |
5.89% |
6.02% |
0.13 |
|
Illegal Re-Entry* |
4.14% |
3.69% |
-0.45 |
|
Assault |
2.65% |
2.68% |
0.03 |
|
Traffic Offense |
1.68% |
2.75% |
1.07 |
|
Drug Trafficking |
1.56% |
1.58% |
0.01 |
|
Burglary |
1.23% |
1.12% |
-0.10 |
|
Marijuana – Possession |
1.05% |
0.97% |
-0.08 |
|
Larceny |
1.00% |
1.06% |
0.06 |
|
Cocaine – Sell |
0.96% |
0.83% |
-0.13 |
|
Domestic Violence |
0.89% |
1.02% |
0.14 |
|
Marijuana – Sell |
0.83% |
0.89% |
0.06 |
|
Drug Possession |
0.69% |
0.80% |
0.10 |
|
Cocaine – Possession |
0.66% |
0.56% |
-0.10 |
|
Dangerous Drugs |
0.65% |
0.78% |
0.13 |
|
Smuggling Aliens |
0.65% |
0.63% |
-0.02 |
|
Robbery |
0.62% |
0.64% |
0.03 |
|
Sex Assault |
0.58% |
0.64% |
0.06 |
|
Public Order Crimes |
0.45% |
0.64% |
0.19 |
|
Total |
100.00% |
100.00% |
|
Note: Illegal Entry pertains to INA Sec.101(A)(43)(O), 8 U.S.C. 1325 only; Illegal Re-Entry pertains to INA Sec.101(A)(43)(O), 8 U.S.C. 1326 only. We assume that missing values for Most Serious Criminal Conviction indicate lack of conviction. To test this assumption, we compared the number of removal records with missing values for Most Serious Conviction against the number of non-criminal removals reported in ICE’s annual report for FY 2017. The number of removals with missing values on Most Serious Criminal Conviction matched the reported 98,420 non-criminal removals in FY 2017.
Source: Authors’ original analysis of ICE Data obtained through FOIA.
Table A3. Most Serious Criminal Conviction – Recoded Using MPI Methodology
|
Category |
Obama |
Trump |
Percentage |
|---|---|---|---|
|
No Conviction |
44.69% |
42.36% |
-2.34 |
|
Immigration (strict) |
17.90% |
17.46% |
-0.43 |
|
FBI Part 2 (nonviolent) |
6.28% |
7.23% |
0.95 |
|
FBI Part 2 (violent) |
6.28% |
6.42% |
0.14 |
|
Traffic (DUI) |
5.97% |
6.13% |
0.15 |
|
FBI Part 1 |
5.86% |
5.96% |
0.10 |
|
Drugs (sale, distribution, transport) |
5.31% |
5.07% |
-0.24 |
|
Drugs (possession) |
3.59% |
3.66% |
0.07 |
|
Traffic (other than DUI) |
1.68% |
2.75% |
1.07 |
|
Domestic Abuse |
1.47% |
1.56% |
0.09 |
|
Nuisance Crime |
0.97% |
1.41% |
0.43 |
|
Total |
100.00% |
100.00% |
|
Note: We assume that missing values for Most Serious Criminal Conviction indicate lack of conviction. To test this assumption, we compared the number of removal records with missing values for Most Serious Conviction against the number of non-criminal removals reported in ICE’s annual report for FY 2017. The number of removals with missing values on Most Serious Criminal Conviction matched the reported 98,420 non-criminal removals in FY 2017.
Source: Authors’ original analysis of ICE Data obtained through FOIA.
Table A4. Percent Increase in Arrests between Last Year of Obama Administration and First Year of Trump Administration, by Areas of Responsibility
|
Area of Responsibility |
Custodial Percent Increase |
At-Large Percent Increase |
Custodial Deviation from National Rate |
At-Large Deviation from National Rate |
|---|---|---|---|---|
|
Atlanta Area of Responsibility |
115.26 |
45.44 |
71.28 |
4.78 |
|
Baltimore Area of Responsibility |
23.13 |
40.09 |
-20.85 |
-0.56 |
|
Boston Area of Responsibility |
15.27 |
84.20 |
-28.71 |
43.54 |
|
Buffalo Area of Responsibility |
12.45 |
123.75 |
-31.54 |
83.09 |
|
Chicago Area of Responsibility |
38.84 |
27.74 |
-5.14 |
-12.92 |
|
Dallas Area of Responsibility |
90.51 |
-23.59 |
46.53 |
-64.25 |
|
Denver Area of Responsibility |
31.56 |
26.19 |
-12.43 |
-14.46 |
|
Detroit Area of Responsibility |
63.42 |
57.55 |
19.43 |
16.89 |
|
El Paso Area of Responsibility |
25.43 |
37.41 |
-18.56 |
-3.25 |
|
Houston Area of Responsibility |
8.30 |
38.35 |
-35.69 |
-2.31 |
|
HQ Area of Responsibility |
112.50 |
0.00 |
68.51 |
-40.66 |
|
Los Angeles Area of Responsibility |
5.69 |
62.57 |
-38.29 |
21.91 |
|
Miami Area of Responsibility |
132.46 |
48.21 |
88.47 |
7.56 |
|
New Orleans Area of Responsibility |
77.94 |
60.75 |
33.96 |
20.10 |
|
New York City Area of Responsibility |
106.69 |
53.13 |
62.70 |
12.48 |
|
Newark Area of Responsibility |
51.39 |
62.10 |
7.41 |
21.45 |
|
Philadelphia Area of Responsibility |
16.62 |
151.30 |
-27.37 |
110.64 |
|
Phoenix Area of Responsibility |
20.79 |
118.22 |
-23.19 |
77.56 |
|
Salt Lake City Area of Responsibility |
20.49 |
30.47 |
-23.50 |
-10.18 |
|
San Antonio Area of Responsibility |
18.85 |
-18.01 |
-25.14 |
-58.67 |
|
San Diego Area of Responsibility |
68.79 |
73.98 |
24.80 |
33.33 |
|
San Francisco Area of Responsibility |
11.24 |
22.89 |
-32.74 |
-17.77 |
|
Seattle Area of Responsibility |
30.93 |
25.36 |
-13.06 |
-15.30 |
|
St. Paul Area of Responsibility |
83.10 |
31.55 |
39.12 |
-9.11 |
|
Washington Area of Responsibility |
56.51 |
16.07 |
12.53 |
-24.59 |
|
Unknown |
33.96 |
19.67 |
-10.02 |
-20.98 |
Source: Authors’ original analysis of ICE Data obtained through FOIA.